Score Scale Tuning and the Three-Dimension Problem
January 30th, 2023

In this article, we explain how machine learning techniques can help achieve complex tasks, such as tuning thousands of parameters at once, with great results.
When tuning transaction monitoring rules, like those used by SAM, there are two aspects to consider: Detection Thresholds and Scores.
- Detection thresholds define the pattern of activity you are trying to detect. For example, a high transfer rule will have a high wire amount threshold that matches what is considered ‘high’ by the business.
- Scores are meant to be a representation of the level of risk a particular pattern represents. The higher the score, the higher the risk. This level of risk is then used to decide whether the detected activity should be presented to an analyst in the form of an alert or whether it should be ignored.
Limitations of Detection Threshold Tuning
In general, detection thresholds are relatively easy to tune because they represent a single numerical dimension and all you need to do is pick the right number. The approach for determining this single number may vary according to where you are in your transaction monitoring system’s life cycle:
If you are prior to go-live, the threshold is usually set to a given percentile of the value distribution across your entire customer base. For low-risk segments of the population the chosen percentile can be relatively high to minimize the noise, for example, it can be set at the 98th percentile of the value distribution. For high-risk segments, it can be set to a lower percentile to increase the proportion of customers that would be investigated, for example, it could be set at the 94th percentile. These values may be overridden by regulatory limits defined by the business.
Once the system is in production, you can analyze alert dispositions and determine the levels of detection for which true money laundering suspicion is found (True Positives) and levels for which no money laundering suspicion is found (False Positives). The threshold can then be adjusted to reduce the number of False Positives while preserving True Positives. In this case, a simple analysis of where you find the first True Positive can be done to determine the right threshold.

This second approach has limitations:
- If very few or no true positives are found for a given variable and a given population, you risk setting the threshold much too high, thereby reducing your coverage significantly. Controls must be put in place to avoid overshooting.
- If true positives are found very close to the threshold, you will not be able to move it that much, thus limiting the impact of the tuning. This could also be an indication that the threshold needs to be lowered.
As a result, it is sometimes difficult to tune a system effectively and obtain a significant reduction in false positives, without compromising on coverage and potentially missing true positives.
The Three-Dimension Problem
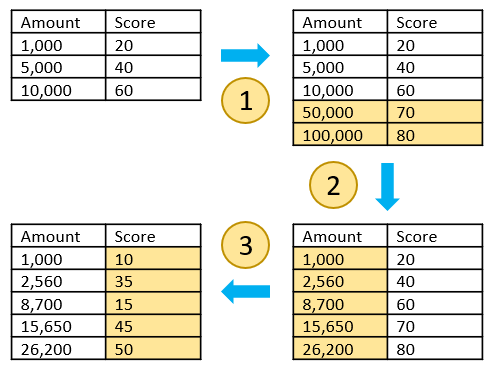
When it comes to scoring, SAM rules use “Score Scales” which enable the business to assign different levels of risk to a range of values. For example, the following score scale can be set up based on the dollar amount detected by a rule:
|
Amount |
Score |
|
$1000 |
20 |
|
$5000 |
40 |
|
$10,000 |
60 |
In this case, we are evaluating the risk to be higher as the amount increases. The question: Is this a true reflection of risk? There are cases where a greater amount doesn’t necessarily indicate money laundering but could indicate another type of issue such as the misuse of an account, for example, an individual account being used for business purposes to avoid paying larger business account fees.
Assessing the true money laundering risk requires an analysis of each variable impacting the score to determine which range of values result in higher proportions of true positives and which range result in lower proportions.
Tuning score scales then becomes a three-dimension problem:

- How many ranges should I use for a given scale?
- What limits should I set for each range?
- What score should I assign for each range?
Contrary to detection threshold tuning where only one dimension needs to be adjusted (the threshold), score scale tuning requires all three dimensions to be adjusted: The number of ranges, the range values, and the scores.
When you multiply these dimensions by the number of score factors per rule, the number of rules and the number of segments, tuning score scales can become a daunting task.
This is the main reason why score scales are rarely tuned: It’s a hard problem to solve.
Reinforcement Learning to the Rescue
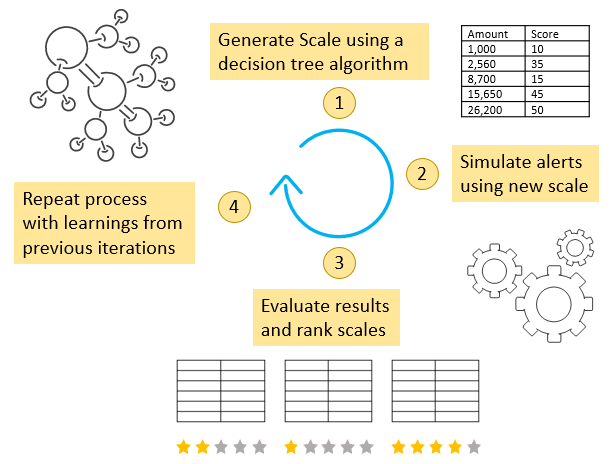
To solve this multi-dimensional problem, we employ a machine learning technique called reinforcement learning, that looks at many different ways of setting up score scales and selects the option with the greatest reward and the lowest penalty.
In our particular use case, a test score scale is rewarded when the greatest number of true positives are preserved (recall rate is high) and a particular test score scale is penalized when the proportion of false positives is increased (precision is going down). The algorithm will typically generate hundreds of different score scales before it finds the optimum one.
Score Scale Tuning Process

The machine learning algorithm can be adjusted to apply a more conservative or a more aggressive approach to determining the optimum set of score scales.
In the following examples, we have run this algorithm on real alert data and have compared the results of a conservative approach versus a more aggressive one:
Conservative approach: We have directed the algorithm to preserve all true positives (100% recall).
The following diagram summarizes the results of the simulation using the generated score scales.

We observe significant gains:
- 26% alert volume reduction
- 38% increase in precision
- 100% recall
- 26 new alerts generated
When adjusting scores, it is possible to generate new alerts because the score may be increased with the new score scales. This is beneficial since the algorithm will increase scores in the regions where more true positives are found. As a result, the new alerts have a higher chance of being true positives, which means that the score scale tuning also recovers false negatives in addition to suppressing false positives.
Aggressive approach: In this instance, we have allowed the suppression of true positives and the algorithm has sought the score scale set with the highest recall rate (in this case, the highest recall rate amongst all the simulations was 97.90%).

We can see that with a more aggressive approach we can reduce the alert volume by more than half, only by tuning the score scales and not performing any detection threshold adjustment.
If we look at the impact of the change across the last 6 months, we see that the system is gradually improving in performance:

- 100% recall rate for the last six months
- Alert volume reduction is increasing
- Precision is increasing
- Volume of new alerts (potential false negatives) is increasing
By employing a reinforcement learning approach to the tuning process, we not only restore the score scale usage to its ultimate purpose, the evaluation of risk, but also bring the real value of tuning to AML, which is the significant reduction of noise and the preservation of coverage.
To learn more, check out this video covering the dos and don’ts of tuning or contact us at asktheexperts@niceactimize.com.


